
Introduction
Raman spectroscopy (RS) is a non-destructive spectroscopic technique used to determine the vibration modes of molecules, although rotational and other low-frequency models may be observed. Raman spectroscopy is commonly used to find a structural fingerprint of molecules in chemistry. Since the characteristics that RS can identify different vibrational frequencies which are specific to chemical bonds, such technique is widely used in biology, medicine, combustion and so on. In solid state physics, RS is used to measure the temperature and crystallographic orientation of a sample. In solid-state chemistry, RS can be used to identify active pharmaceutical ingredients and their polymorphic forms. RS helps to confirm the low-frequency of DNA and proteins in biology and medicine. Explosives, pollutant and other desirable species can be detected with portable RS devices in practice which is also widely in use. In the field of combustion, RS is also one of the approaches for combustion diagnostics. Lapp and Hartley gives a comprehensive review of such technique in combustion. RS can identify species in combustion field and measure the species fraction or temperature as well. With the high-frequency pulsed laser source, RS can realize one-dimensional measurements for combustion field. Another advanced technique is Coherent Anti-Stokes Raman Spectroscopy(CARS), which can extensively eliminate the effect of fluorescence and surrounding noise, albeit with higher cost. RS developed in the laboratory is a primitive facility for point measurement of species and designed to measure the species fractions and temperature in the future.
Instrument Components
RS consists of two major components, the sample chamber and the spectroscopy together with two affiliated components, optical fiber transmitter and standard light source. The descriptions of different components in the spectroscopy are listed.
Sample chamber
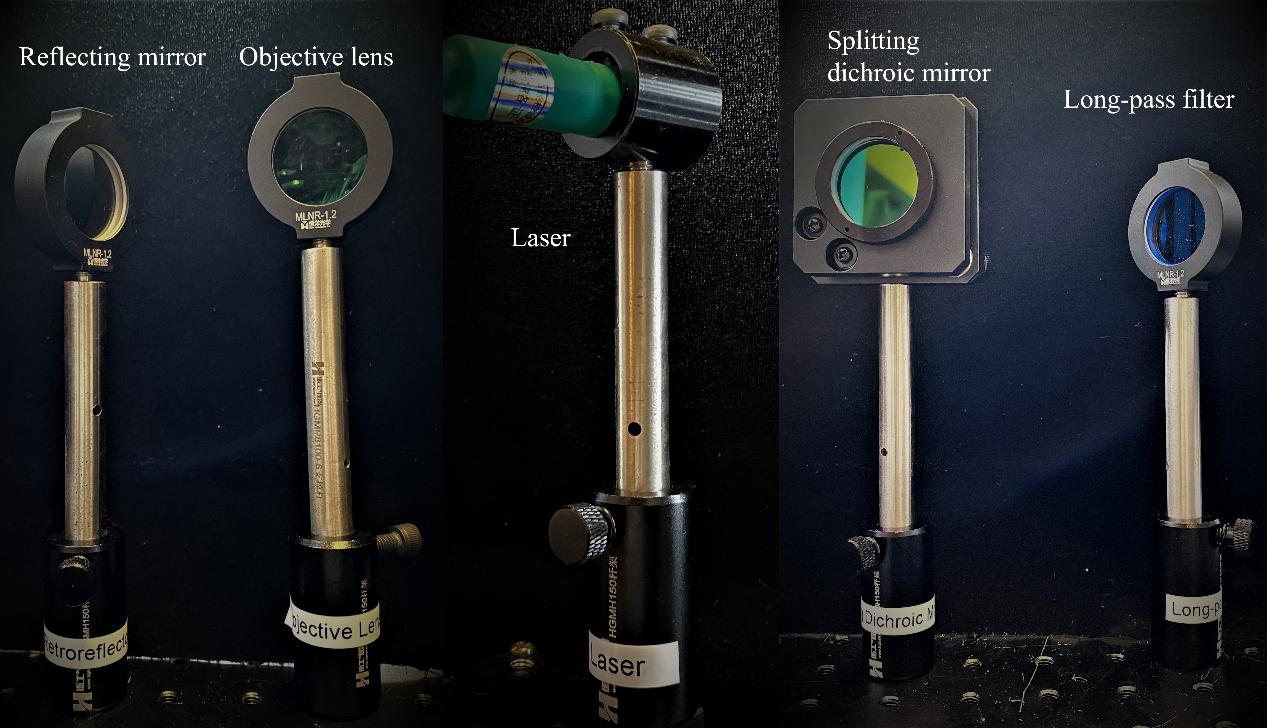
- Sample holder. Sample holder is set on the outer frame. Gas, liquid and solid samples can be placed on the sample holder. Another combustion chamber is being developed.
- Objective lens. The conjugate distance of the objective lens is 185mm and magnification factor is 4.
- Beam splitting dichroic mirror.
- Long-pass filter.
- Collection lens. The conjugate distance of the objective lens is 100mm.
- Light trap
Optical fibre transmitter
- Optical fiber coupler. The optical fiber coupler has SMA905 port.
- Optical fiber. The dimeter of the optical fiber is 0.6mm with SMA905 ports both ends.
- Optical fiber collimator. The optical fiber collimator has SMA905 port.
Spectrometer
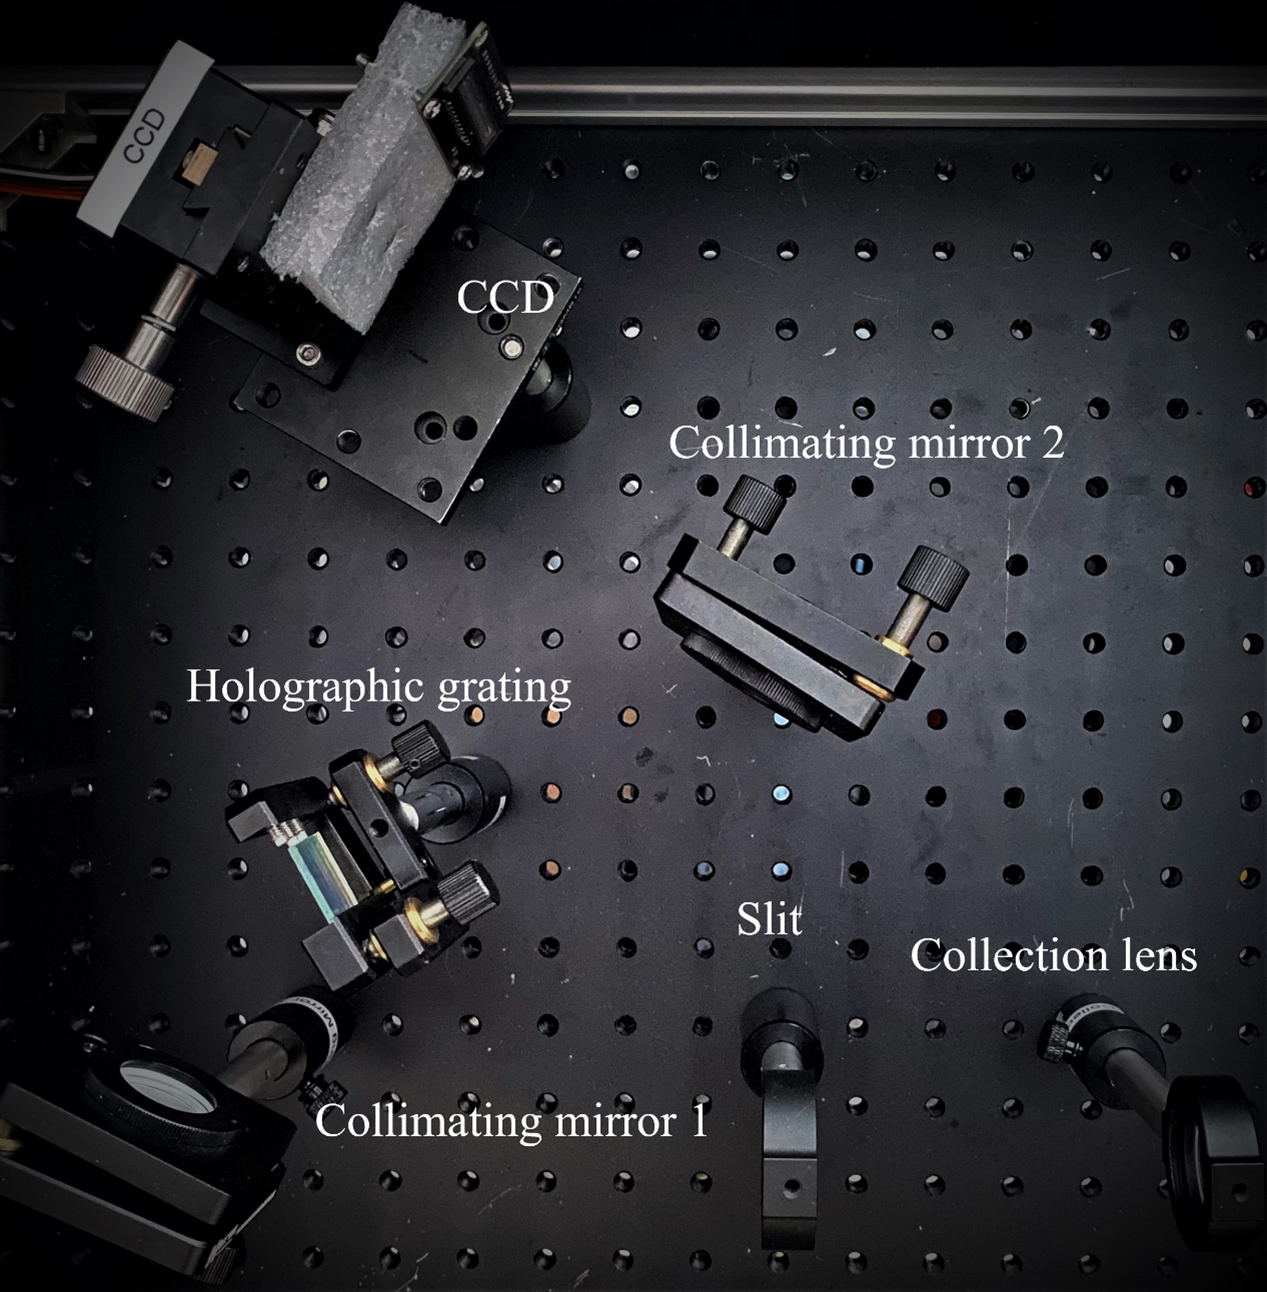
- Silt. The rectangular slit has the width of 0.3mm.
- Concave mirror 1
- Grating. The line density of the reflecting holographic grating is 600 per mm.
- Concave mirror 2
- Line CCD camera
Standard light source
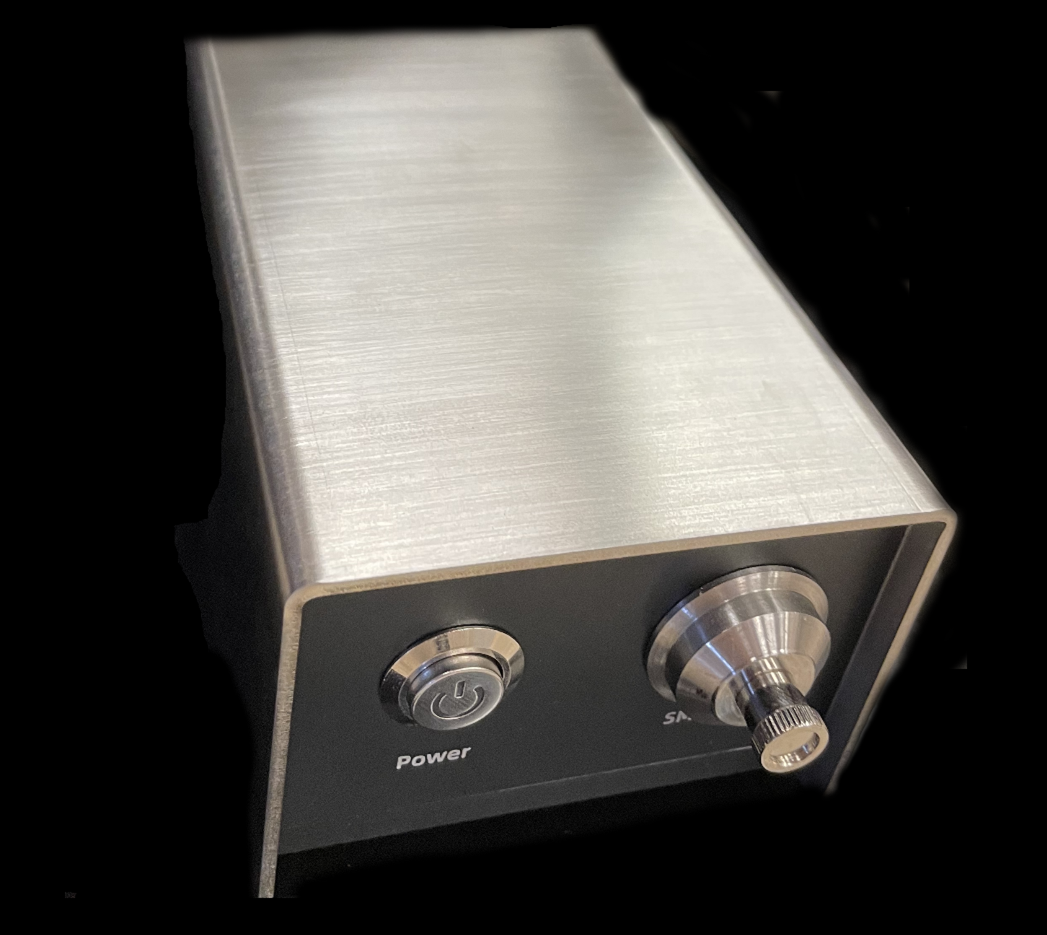
- The standard light source is taken from the Hg-Ar atomic emission.
Instrument Principles
Background
Three conditions exist when the light hits the materials. If the material is homogeneous and there is no heat fluctuations, no interactions appear between the lights and the materials. The lights got through from the materials dos not change and the wavelength and the direction do not change consequently. If the material is non-homogeneous and non-dynamics heat fluctuations exist, the direction of the light through the materials changes and the frequency does not change. Such phenomena is recognized as the elastic scattering. If dynamic heat fluctuation of the material exists, energy exchanges between the lights and the materials appear, the frequency changes, which is known as the inelastic scattering. The inelastic scattering was firstly proposed by Smekal in 1923 and observed by C.V. Raman in 1923 from the 423.85nm lights through the tetrachloromethane solution. The inelastic scattering is named as Raman scattering since then. The technique was not put into practice at the beginning because the intensity of Raman scattering is about 10-6 of the incident light, which makes the scattering difficult to be observed and quantified. The Raman Spectroscopy technique boosts around 1970s because of the emerging of laser. The performance as monochrome, intensity, directivity and polarization is excellent of laser. Laser thus becomes the popular excitation source form Raman spectroscopy. Anther boost is the development of Charge Coupled Device (CCD), which can massively reduce the measing period. Meanwhile, other techniques flourish such as Surface-enhanced Raman Spectroscopy (SERS), Resonance Raman Spectroscopy (RRS), Coherent Anti-Stokes Raman Scattering (CARS) and so on. In the field of combustion, CARS is the popular diagnostic method to measure the species, fractions and temperature of the gas phase.
Theories
Theories both from electrodynamics and quantum mechanics can explain and describe the inelastic scattering. The energy inside the molecular is from translation, rotation, vibration and electron. The electron energy changes leads to the fluorescence. Raman scattering is triggered by the molecular vibration in major. For the molecule consisting of N atoms, the Degree of Freedom (DOF) of such system is 3N, as the translation, rotation and vibration around the equilibrium point. The translation DOF of the centre of mass is 3. Rotation DOF of linear and non-linear molecules is 2 and 3 respectively. Therefore, (3N-6) and (3N-5) are the vibration DOF. The vibration can be decomposed into finite normal vibration with the superposition principle. For the case that the vibration DOF is (3N-6), the normal coordinate, which is one kind generalized coordinates, is . Each normal coordinate is controlled by the normal frequency as,
\[\begin{aligned} &\boldsymbol{A}=\boldsymbol{A}_{0}+\sum_{k=1}^{3 N-6}\left(\frac{\partial \boldsymbol{A}}{\partial q_{k}}\right)_{0} Q_{k} \cos \left(\omega_{k} t+\varphi_{k}\right) \\ &+\frac{1}{2} \sum\left(\frac{\partial^{2} \boldsymbol{A}}{\partial q_{k} \partial q_{1}}\right) Q_{k} Q_{l} \cos \left(\omega_{k} t+\varphi_{k}\right) \cos \left(\omega_{l} t+\varphi_{l}\right)+\cdots \end{aligned}\]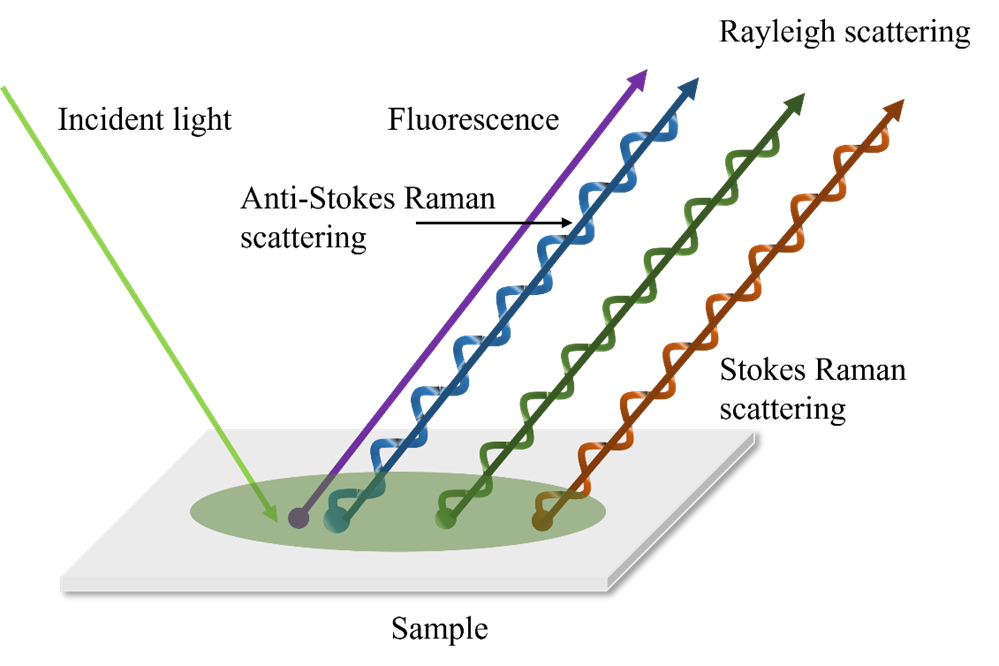
It also can be concluded that the Raman scattering spectrum corresponds to the molecular vibration that can cause the polarization rate to change. Different Raman scattering lines have different direction and polarization. The higher orders are usually ignored because the effect are minor. The explanation and model from electrodynamics successfully describe the mechanism, quantity and shift of the Raman scattering. However, phenomena like the reason why the intensity of anti-Stokes lights are smaller than the Stokes lights cannot be fully understood. Theories from quantum mechanics can provide necessary supplements. The photon not only changes the direction of motion, but also exchanges energy with the material molecule in an inelastic collision. This process can be seen as the annihilation of the incident photon and the production of another scattered photon of different energy. At the same time, the energy state of the molecule undergoes a transition. This inelastic collision process leads to the generation of Raman scattered light. The Figure below illustrates the process of Rayleigh and Raman scattering. and are the two energy levels of vibration. The dash lines represent the virtual energy state, which represents the energy levels of the incident and scattered photons. Molecules at the ground state collide with the photons with frequency . The molecule returns to the ground level by excited through the virtual state. Meanwhile, excited photons emit. If the ground and final states are the same, Rayleigh scattering occurs. The frequency of the emitted photons is . If the energy levels between the ground and final levels are different, Raman scattering occurs. The change of the frequency is .
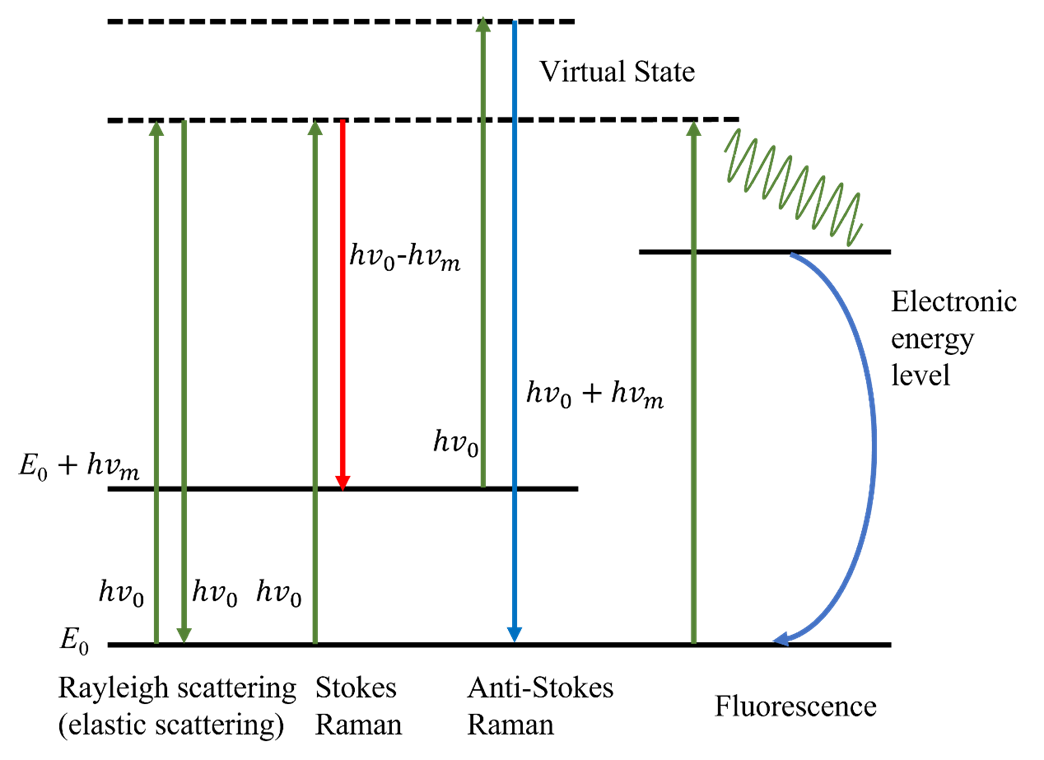
The energy level represented by the dashed line, the virtual state, does not correspond to any electron energy level or state of the scattering system. It is only used to describe the energy of the incident and the scattered photon. In other words, the position of the virtual state can be arbitrary. Therefore, the frequency of incident photons in Raman scattering is not limited by the energy level distribution of the system under test. The change of the frequency of the scattered light relative to the incident light depends on the energy level spacing of the material molecules, which suggests that the frequency shift of Raman scattering is constant, depending on the nature of the scattering material itself, and not changing with the incident light frequency.
According to the law of statistical distribution, the molecules follow Boltzmann distribution at the equilibrium state,
The number of molecules at higher energy levels is less than the number of molecules at lower energy levels. It explains that the reason that the intensity of anti-Stokes scattering is much weaker that the Stokes scattering.
Many similarities exist between infra-red absorption and Raman scattering. The infrared absorption spectrum is caused by the change of the inherent electric dipole moment of the molecule, and its absorption intensity is proportional to the square of the polar transition matrix element. The normal vibration modes that can participate in the infrared absorption process are called infrared active. The Raman spectrum (excluding Rayleigh scattering) is caused by the change of the induced electric dipole moment of the molecule, and the intensity is proportional to the polarizability tensor momen square of the derivative of the element to the normal coordinate so that the derivative of the polarizability tensor matrix element is not zero is called Raman active, and according to the symmetry of the molecule, Determine which normal vibration modes have Raman activity. Therefore, these two spectra can complement each other to obtain more comprehensive material structure information.
Light path and receiver
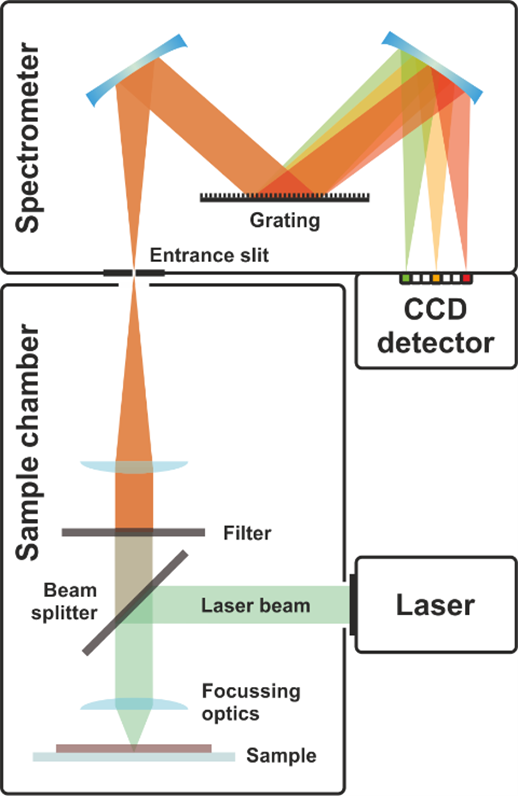
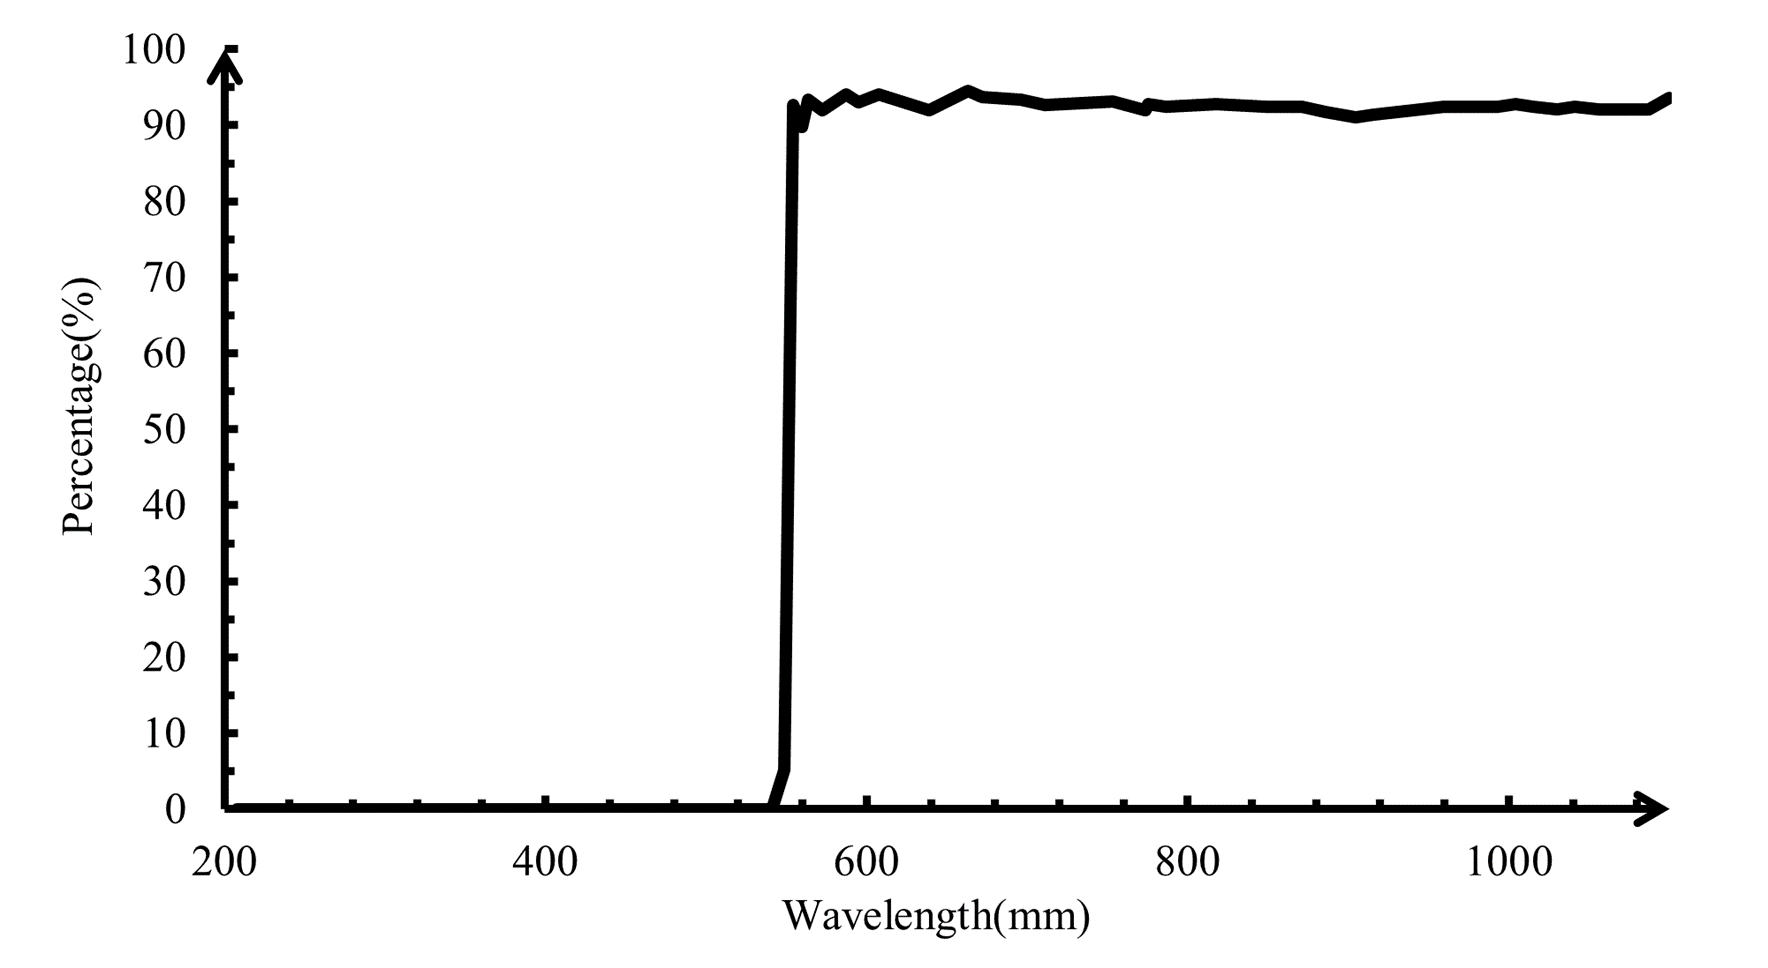
The sample chamber consists of laser source, beam splitting dichroic mirror, objective lens, sample holder, filter lens and focusing lens. The laser source emits the light of 532nm with the power of 200 mW. The beam splitting dichroic mirror can reflect the photons with the wavelength below 532nm and transmit photons with the wavelength over 532nm. The response of the beam splitting dichroic mirror is shown in Figure 2.
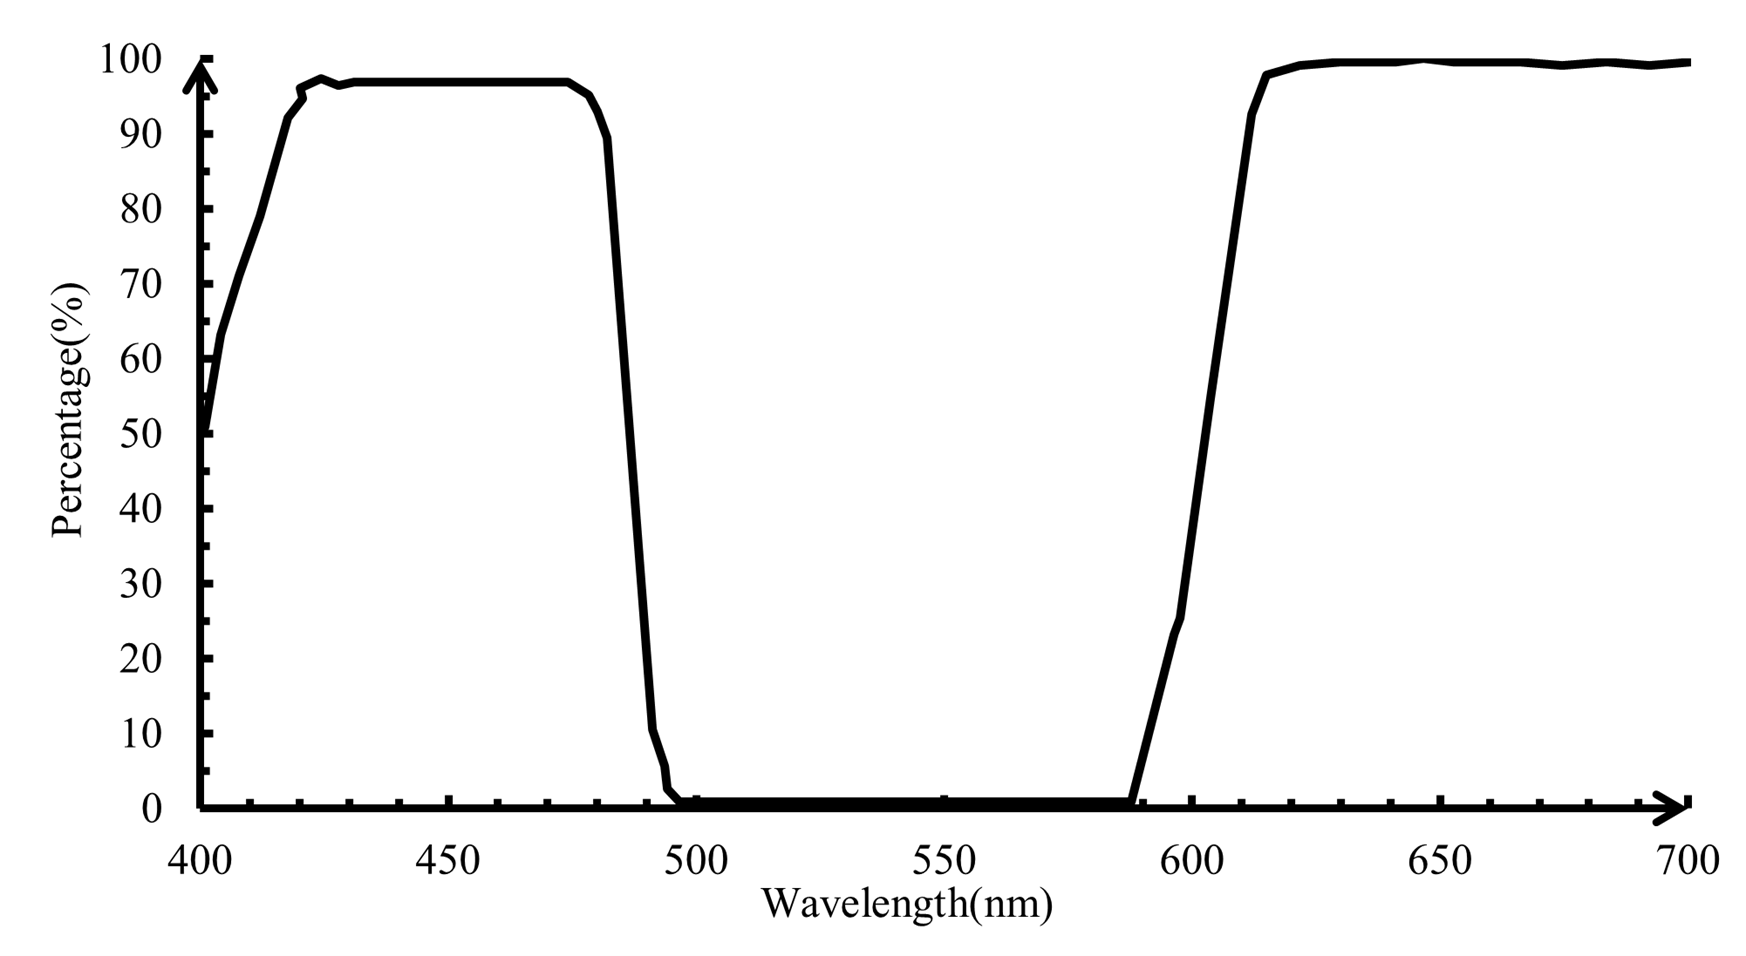
The lights reflected from the beam splitting dichroic mirror pass the objective lens. The conjugate distance of the objective lens is 185mm and magnification factor is 4. When the focal point is on the sample, scattering appears. The scattered lights pass back from the sample and around 70% the photons with the wavelength below 580nm are reflected. The transmitted light goes through the long-pass filer. The response diagram of the long-pass filter is shown in Figure 3.
The collection lens behind the filer lens is to focus and lights. Then, the collected scattered lights are analyzed by the spectroscopy. Grating spectroscopy is used to analyze the scattered lights. The spectroscopy consists of one slit, two concave mirrors, one grating and one receiver. The scatter lights firstly pass the slit. The rectangular slit has the width of 0.3mm. The diffraction of the lights are projected on the first concave mirror and turned as the parallel lights. The diffraction lights are dispersed through the grating. The line density of the reflecting holographic grating is 600 per m. Several interference fringes appear. The brightest non-zeroth fringe is used as the spectrum and projected on the surface of the second concave mirror. The receiver, the line CCD, is used to collect the spectrum.
Instrument Installations
Installation of the optical elements
##
##
##